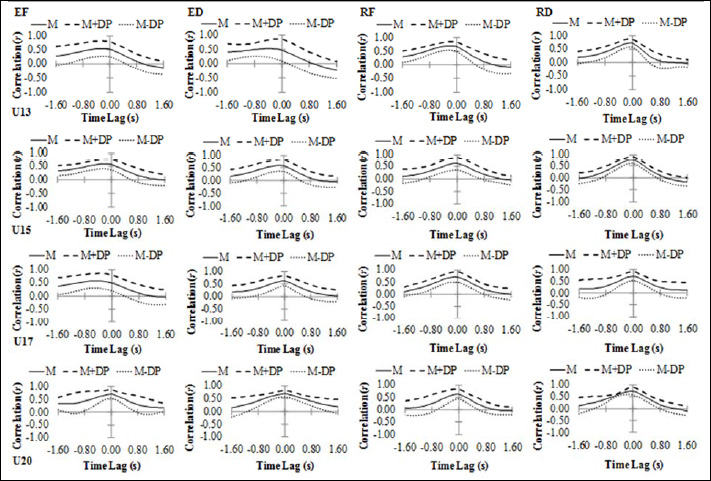
Figure 4. Mean and standard deviation (M ± SD) point-to-point for the cross-correlation coefficient between Dbm and Dbcent in the different time lags. The lines correspond to the different age categories and the columns correspond to the different task constraints.