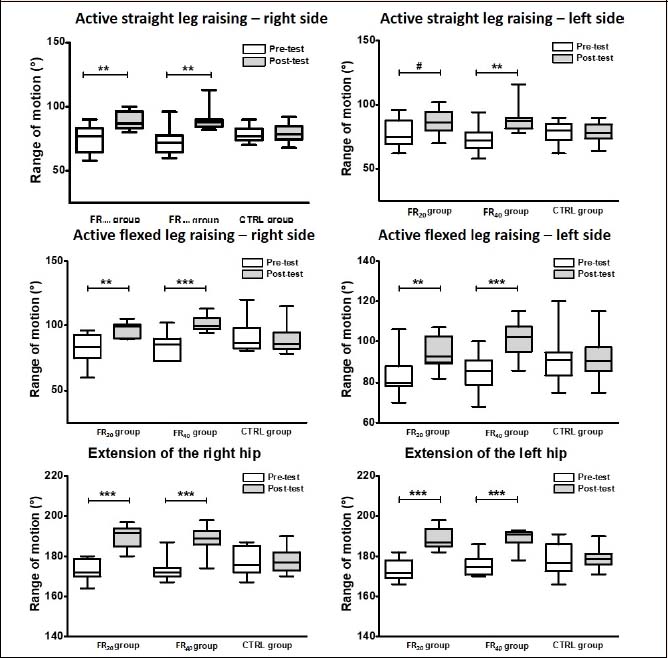
Figure 4. Range of motion before and after the foam rolling intervention. The figure shows the median and quartile values. Only significant differences in ROM between the pretest and the post-test are displayed. # p = 0.06, * p < 0.05, ** p < 0.01, *** p < 0.001.