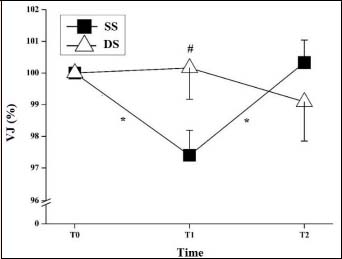
Figure 4. Comparison of vertical jump (VJ) heights after static (SS) and dynamic (DS) stretching, across three time blocks. Mean group data are presented; vertical bars represent standard error. Star (*) represent significance р<0.05 during time in one protocol; Hashtag (#) represent significance p<0.05 between two protocols in one time point.