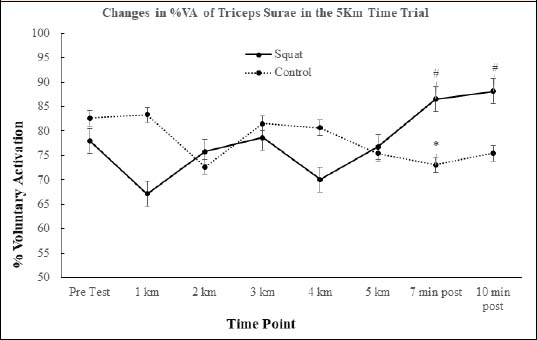
Figure 4. Representative graph demonstrating the change in %VA (voluntary activation) over the course of the interventions. Potentiated can be seen at seven and 10 minutes post-run (squats). * indicates the control condition value was significantly lower than pre-test. # indicates the squat condition value was significantly greater than the control condition.