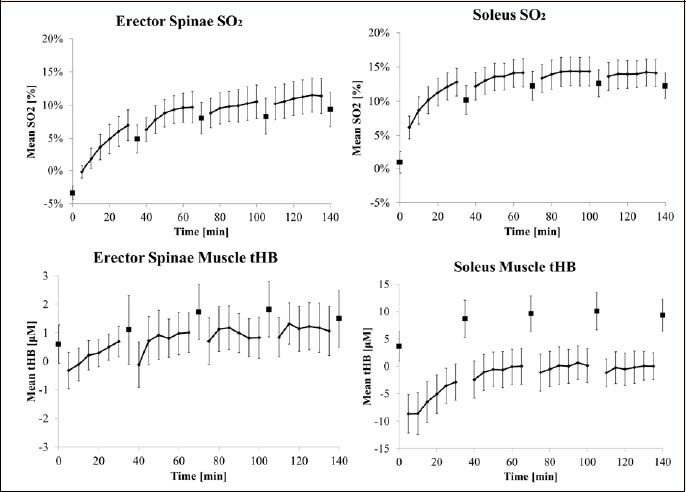
Figure 4. Average value every five minutes for each muscle SO2 (top) and tHb (bottom) relative to the initial baseline period. ES shown on left and SOL muscle on right. Standing period values are shown as squares. Walking period values are connected by lines. Standard errors are shown. Note scale differences for ES and SOL tHb.