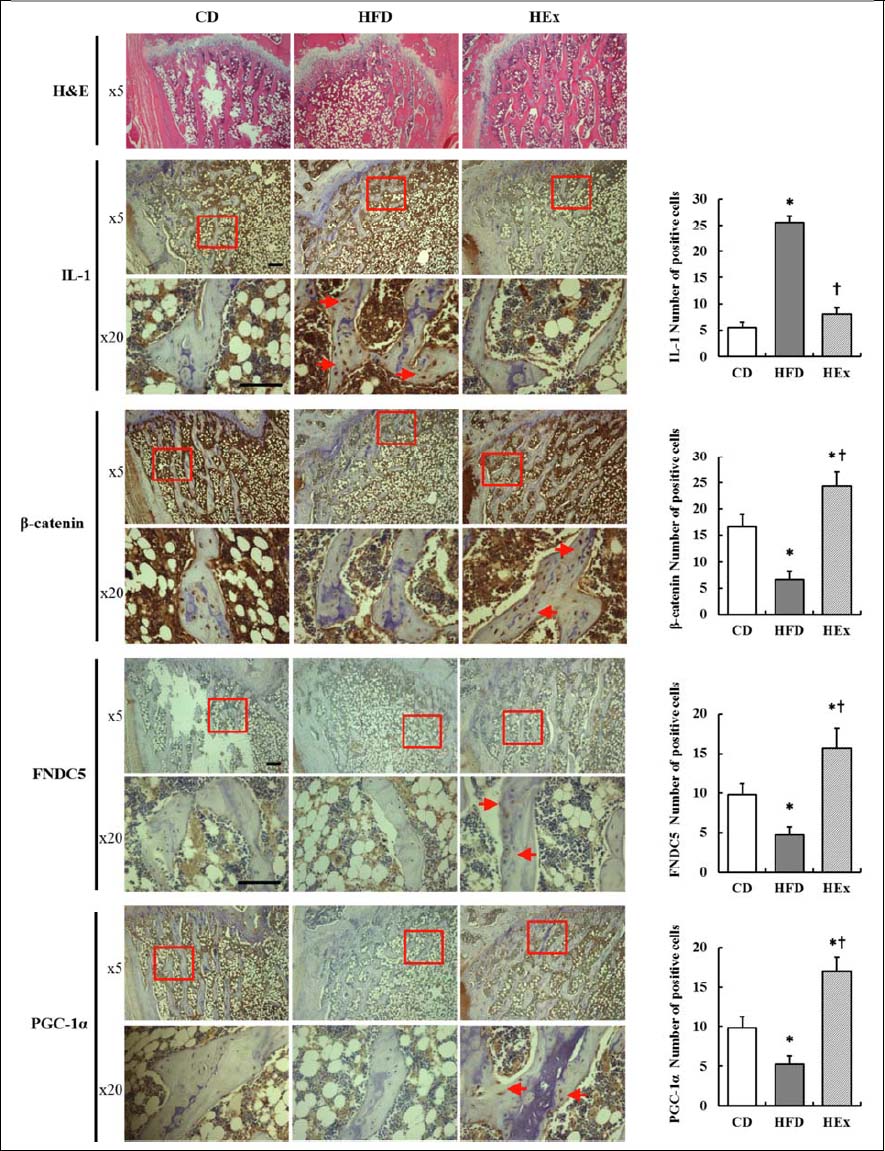
Figure 4. The expression of IL-1, β-catenine, FNDC5 and PGC-1α in the femur at the end of 16 weeks of experiment. Representative hematoxylin and eosin (H&E) staining of longitudinal section of femoral bone in each group. The magnification of each specimen was ×5 and ×20. Scale bars represent 50µm. Expression of IL-1 and β-catenine, FNDC5 and PGC-1α manifested by the brown staining of the DAB dye, was visualized in the nuclei (short red arrows) of femur by IHC. At least five slides from each specimen were quantified. CD, control diet; HFD, high-fat diet; HEx, high-fat diet and swimming exercise; IL-1, interleukin 1; FNDC5, Fibronectin type III domain-containing protein 5; PGC-1α, Peroxisome proliferator-activated receptor gamma coactivator 1-alpha. * p < 0.05 vs. ND, † p < 0.05 vs. HEx by one-way ANOVA.