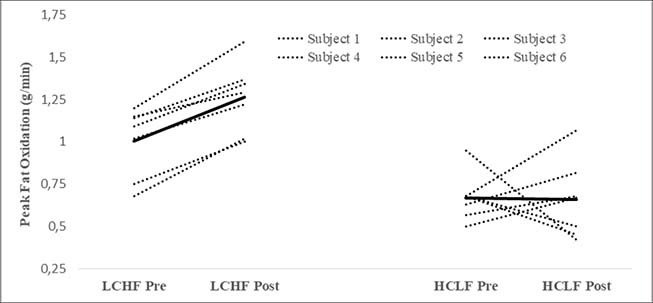
Figure S2. Individual peak fat oxidation rates measured during the maximal exercise test (VO2max). Mean responses between groups were significantly different (p = 0.001). Solid lines indicate mean. LCHF, very low carbohydrate high fat; HCLF, high carbohydrate low fat. Pre = Day 1; Post = Day 39.