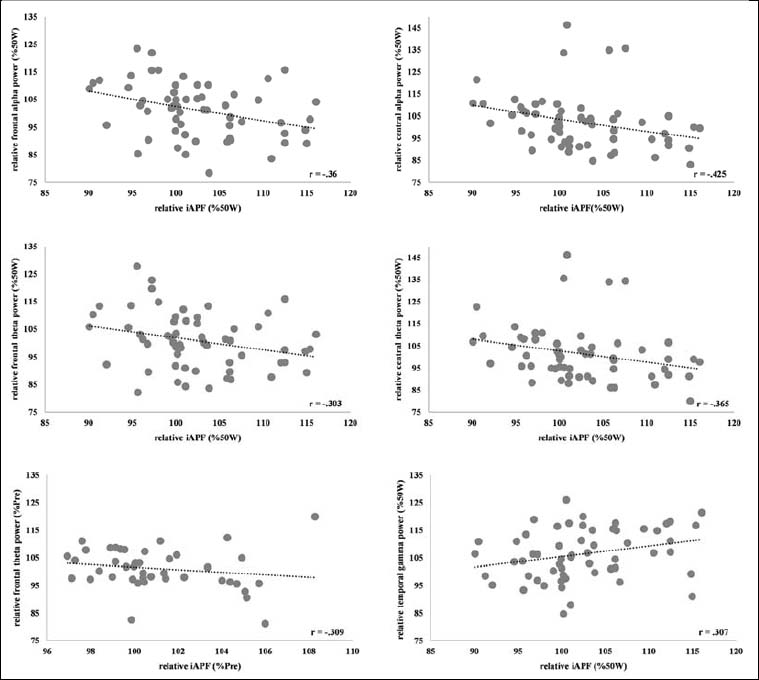
Figure 4. Correlations of specific EEG frequency band power with iAPF during GXT and in recovery. GXT data normalized to 50W-values and presented as %50W, data of 50W excluded. Post5-15 data normalized to Pre-values and presented as %Pre. r Spearman’s rank correlation coefficient.