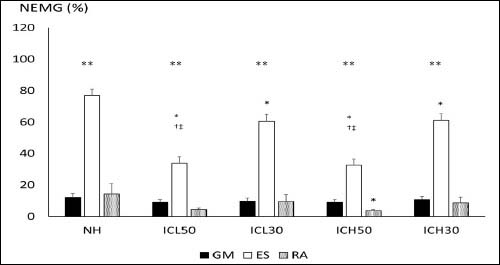
Figure 4. Comparison of the NEMG (%) of GM, ES, and RA muscle among NH, ICL50, ICL30, ICH50, and ICH30. *, † , and ‡ represent a significant difference (p < 0.05) when NH, ICL30, and ICH30 are compared. ** represents a significant difference (p < 0.05) between ES compared to GM and RA.