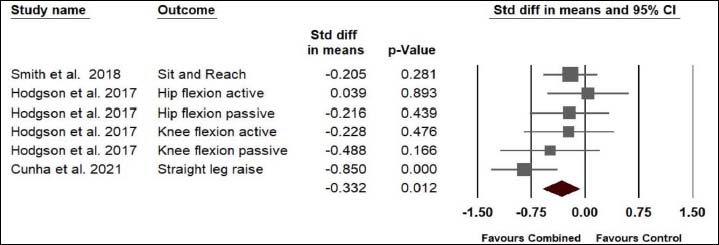
Figure 4.
Forest plot presenting the combined effects compared control condition on range of motion. (Std diff in means = standardized difference in means; CI = confidence interval).