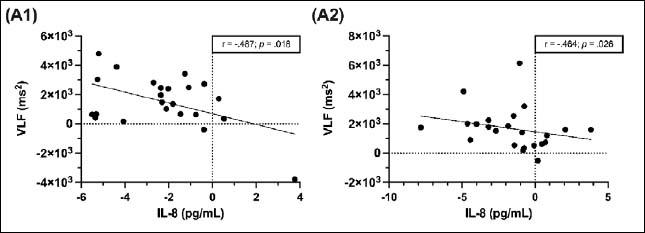
Figure 4. Correlations between IL-8 and VLF in men at both RTs in recovery phase after RTs. (A1) shows the recovery response of RT1, (A2) of RT2. Differences between the MTPs were used for the analyses. Significant correlations are presented with p < 0.05, n = 23.