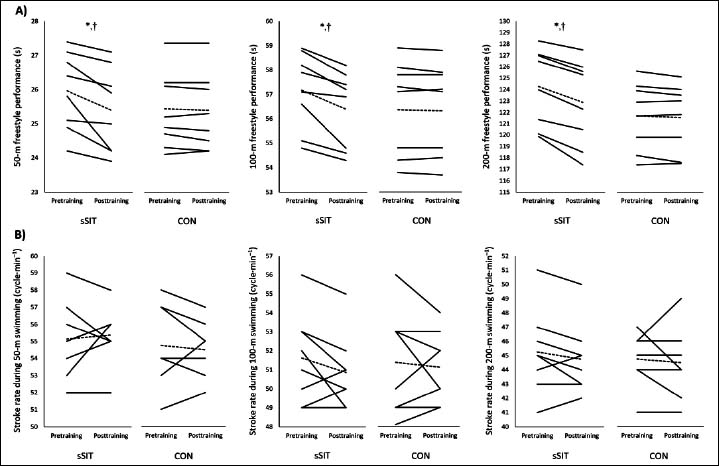
Figure 4. Effects of sSIT and CON on time and stroke rate in 50, 100, and 200-m freestyle swimming performance. N = 8 for each group. Each line represents an individual participant and the dotted line represents the mean response. * Denotes significant difference vs. pre-training (p ≤ 0.05). † Denotes significant difference vs. CON group (p ≤ 0.05).