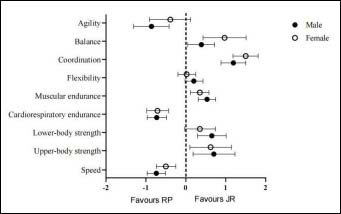
Figure 4.
Forest plot of differences in physical performance indicators between the regular physical education class group and the jumping rope class group.