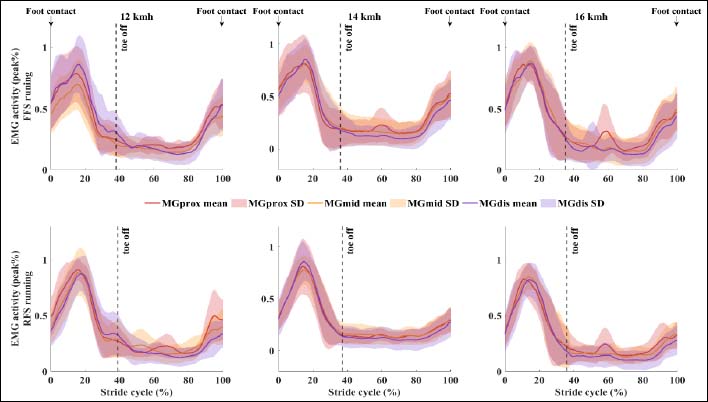
Figure 4. Regional EMG activity of medial gastrocnemius. Regional EMG activity (normalized to maximum EMG activity) of the medial gastrocnemius at different running speeds during forefoot and rearfoot strike running. Colored lines represent group means and SD across the stride cycle at different speeds for each region, upper panels during forefoot strike while lower panels during rearfoot strike running. The dashed black vertical line shows the end of the stance phase at the corresponding running speed. Statistically significant differences are marked with black horizontal lines above the EMG curves. Dashed line: differences between the proximal and middle region, solid line: differences between proximal to distal region, dotted line: differences between middle and distal region. MGprox - medial gastrocnemius proximal region, MGmid – medial gastrocnemius middle region, MGdis – medial gastrocnemius distal region, FFS – forefoot strike running, RFS – rearfoot strike running.