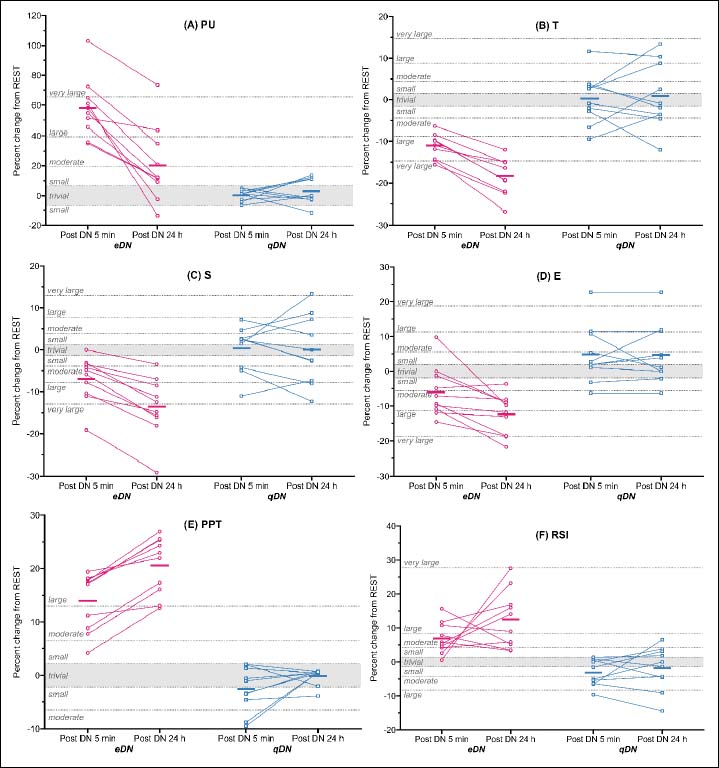
Figure 4. Percent changes in the analyzed indices after 1-5 min and 24 h of DN. eDN - experimental group; qDN – sham group; A: blood perfusion (PU), B: muscle tone (T), C: dynamic stiffness (S), D: elasticity, E: pressure pain threshold (PPT) and F: reactive strength index (RSI) / muscle power. Data are adjusted group means (solid dash), plus unadjusted individual percent changes. The trivial region was determined from the smallest worthwhile change for each variable (0.2 × combined between-subject baseline SD).