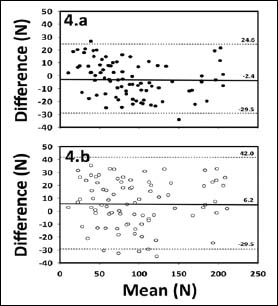
Figure 4. Bland–Altman plots for the comparison between active drag coefficient estimated using resisted swimming (DaST) and estimated using the planimetric method (DaPL) (panel 4.a) or between DaST and active drag coefficient estimated using the fitted model (DaSTfit) (panel 4.b). The solid black line represents the mean of the differences (mean bias), and the two dotted lines represent the 95% confidence interval of limits of agreement.