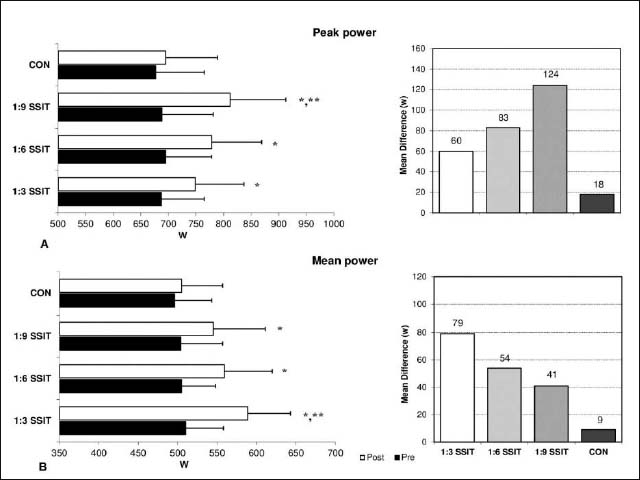
Figure 4. Changes in anaerobic peak and mean power output following the 7-week SSIT (Mean ± SD). * indicates significant differences versus pre-value and CON (p < 0.05). **indicates significant differences compared with 1:3 SSIT in peak power and with 1:9 SSIT in mean power (p < 0.05).