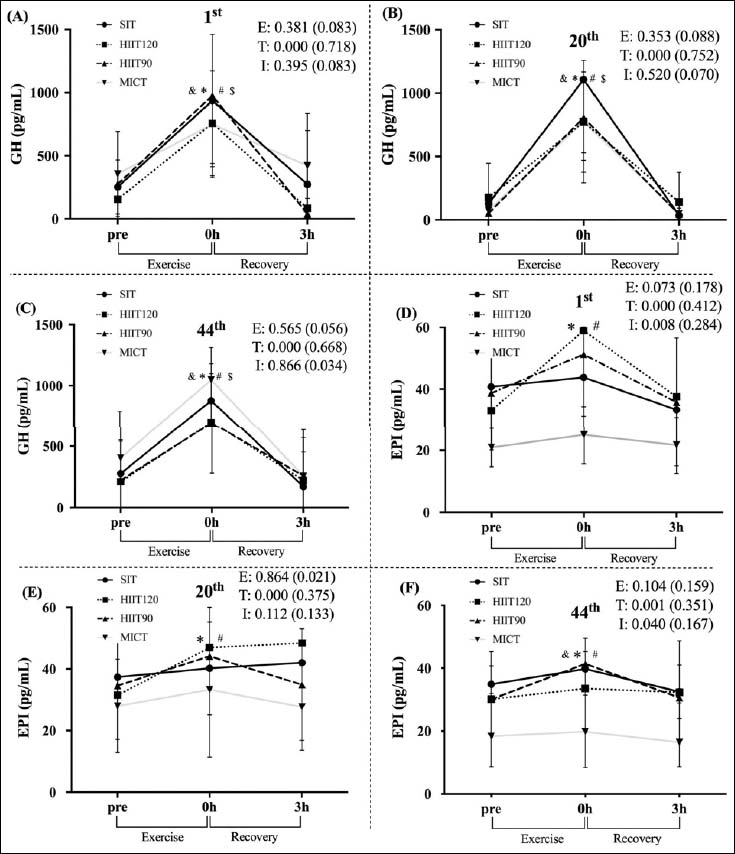
Figure 4. Comparison of GH (A, B, C) and EPI (D, E, F) during three times of acute exercise in 12 weeks of each exercise group. 1st, first acute exercise (A, D); 20th, 20th acute exercise (B, E); 44th, 44th acute exercise (C, F). Pre, before exercise; 0h, immediately after exercise; 3h, 3 hours after exercise. E, group effect (η2); T, time effects (η2); I, interaction effects (η2). * p < 0.05, a significant difference compared with pre in the HIIT120 group. # p < 0.05, a significant difference compared with pre in the HIIT90 group. & p < 0.05, a significant difference compared with pre in the SIT group. $ p < 0.05, a significant difference compared with pre in the MICT group.