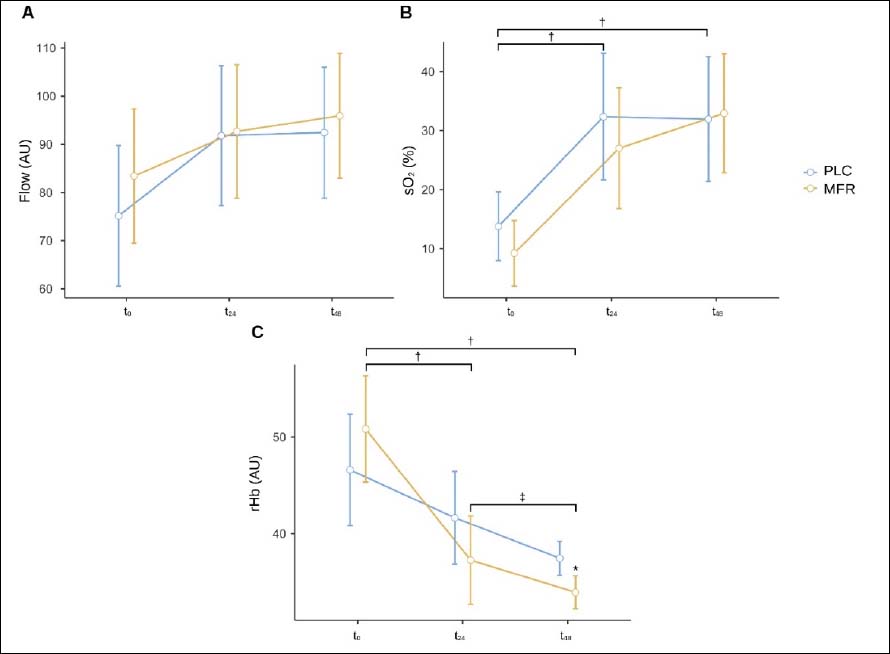
Figure 4. Microcirculation parameters. A Blood flow. B Oxigen saturation. C Relative haemoglobin. AU, arbitrary units; sO2, oxygen saturation; rHb relative haemoglobin; t0, baseline; t24, 24 h after exercise; t48, 48 h after exercise. † Significant time differences to t0 at p < .05 level. ‡ Significant time differences to t1 at p < 0.05 level. * Significant group differences at p < .05 level. Error bars show the 95% confidence interval.