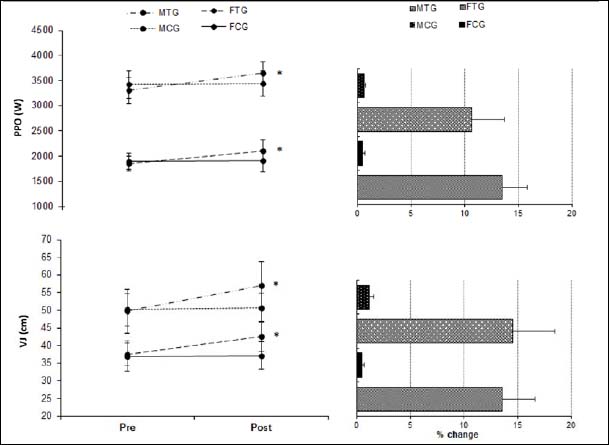
Figure 4. Changes in vertical jump (VJ) and peak power output (PPO) in response to 6 weeks sSIT (mean ± SD). FTG: female training group, FCG: female control group, MTG: male training group, MCG: male control group. * Denotes significant difference vs. control group and pre-training (p ≤ 0.05).