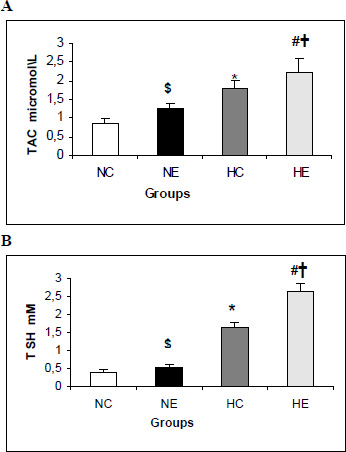
Figure 5. Comparison of the chronic exercise effect and /or high cholesterol diet on plasma TAC and T-SH concentrations among four groups in rabbit. Data are expressed as mean ± SD (n=15 for each group).Differences of p<0.05 were considered significant.