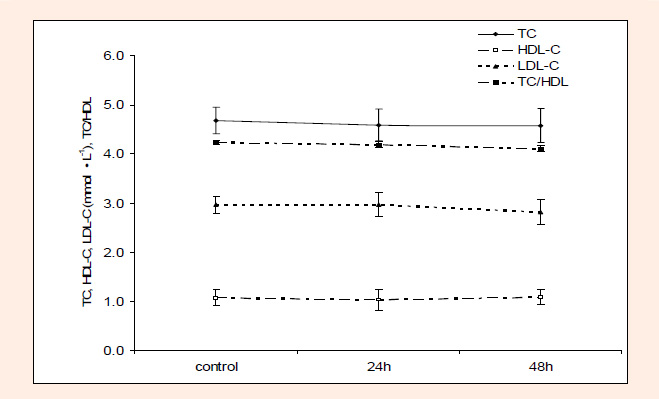
Figure 5.
TC, HDL-C and calculated LDL-C concentration in the control condition and 24 and 48 h post-exercise. Values are means (± SE). (n = 9).