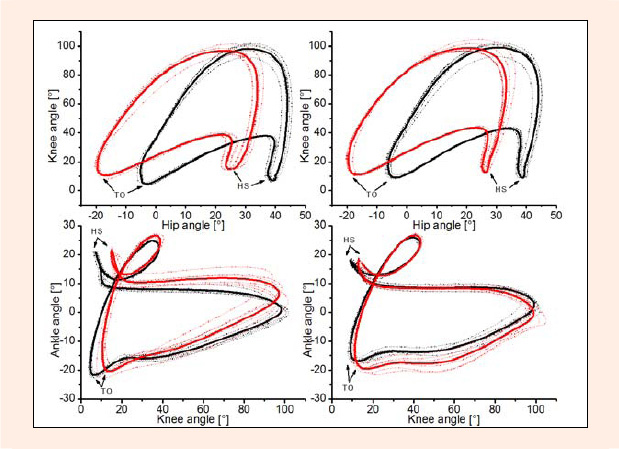
Figure 5. Hip-knee and knee-ankle angle-angle plots of one representative runner. The left two graphs display the pre-test data, the right two the post-test data. The upper level shows the hip-knee plots and the lower two the knee-ankle plots. Black dotted lines show NT running means of each 2-min block, red dotted lines RT running means of each block. The thick black and red lines represent the grand mean of the entire 30 min test. Especially in the knee-ankle plots, the higher variability due to the RT and the occurred adaptation to them are well reflected. Heel strike is indicated by HS and toe-off by TO.