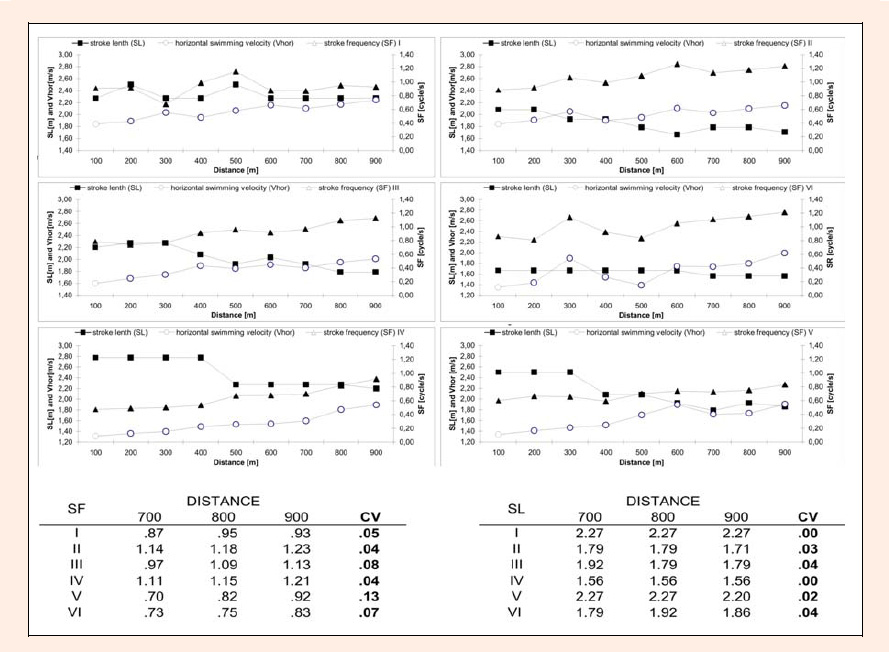
Figure 5. Graphs illustrating the division of stroke frequency (SF) and stroke length (SL) compared with average horizontal swimming velocity (V) registered on all nine of the 100m-intervals of the test distance. A table of values of the stroke parameters registered on the last three 100m-intervals of the test distance is supplemented by the coefficients of variation (CV) estimated. The results are ranked by average swimming velocity achieved by each swimmer.