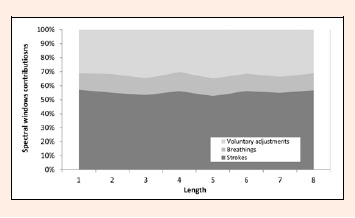
Figure 5.
Area chart representing the relative contributions (%) of the 3 causes of the LF in each length.