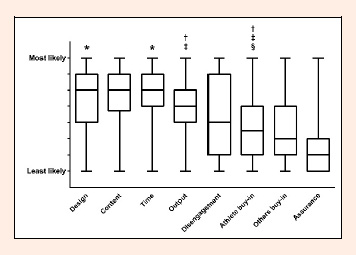
Figure 5. Box and whisker plot for the likelihood of factors to interfere with compliance across all athletes (n = 131). * more likely to interfere for individual compared to team sport athletes, † more likely to interfere for team sport compared to individual athletes, ‡ more likely to interfere for supported compared to self-directed athletes, § more likely to interfere for recreational compared to higher-level athletes (p < 0.05).