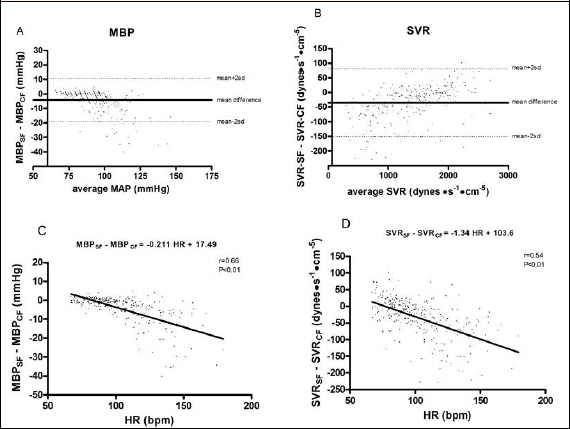
Figure 5. Bland and Altman plots of the difference between mean blood pressure (MBP, panel A) and systemic vascular resistance (SVR, panel B) calculated with the standard and the corrected formulas. Panels C and D show results of the linear regression statistics applied to HR versus the differences in MBP and in SVR provided by the two methods of MBP calculation.