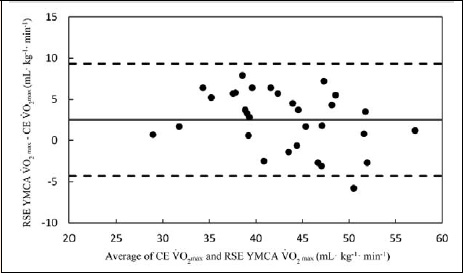
Figure 5.
Bland-Altman plot of CE measured V̇O
2
max and RSE YMCA estimated V̇O
2
max