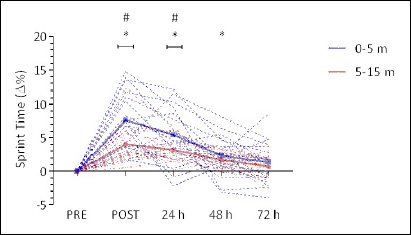
Figure 5. Percent change in 15 m sprint time before, immediately after and 24, 48, and 72 h following impact induced muscle damage (IIMD). Data represents individual 0-5 m (blue dotted trace), and 5-15 m (red dotted trace) split times expressed as a percentage of PRE values. Mean values are highlighted in solid lines with error bars omitted for clarity. *Significant (p < 0.01) difference from PRE. # Significant (p < 0.01) difference between 0-5 m and 5-15 m ∆% from baseline.
