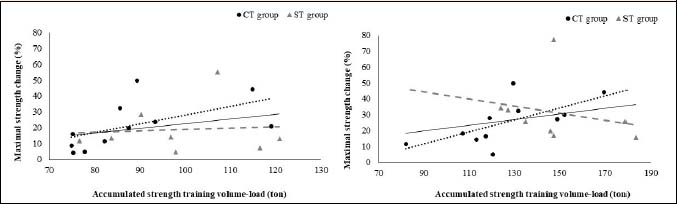
Figure 5. Relationships between changes in maximal strength and accumulated volume-load at week 8 and week 12 for the ST and CT groups. Solid trend line: overall group; grey streak trend line: ST group; black dashed trend line: CT group. There was a statistically significant positive correlation between accumulated volume-load performed and maximum strength gains in 8 weeks for CT group isolated (p = 0.028; r = 0.645).