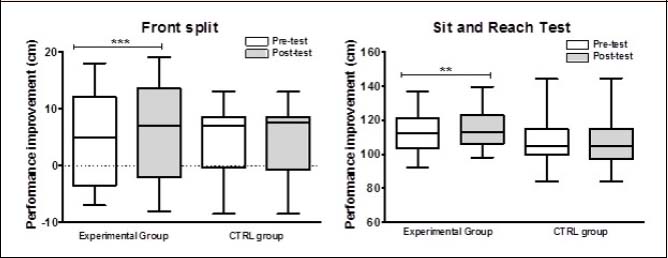
Figure 5.
Performance gains before and after the intervention. The figure shows the median and quartile values. Only significant performance gains between the pretest and the post-test are displayed. ** p < 0.01, *** p < 0.001.