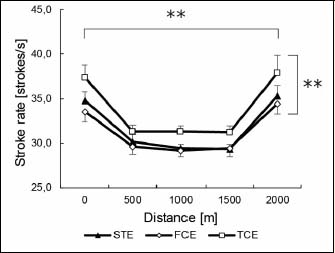
Figure 5. Average stroke rates throughout the race. The asterisks on the horizontal lines indicate a statistically significant effect of distance (* for p < 0.05 and ** for p < 0.01), while those on the vertical line indicate statistically significant effect of condition (ergometer type).