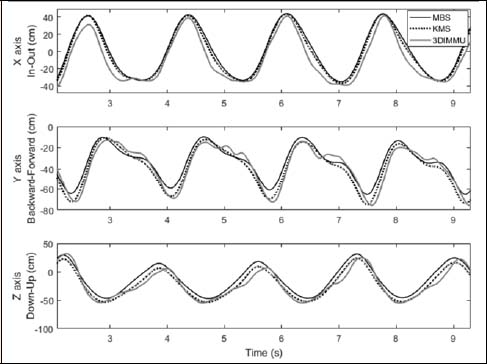
Figure 5.
Temporal data series of the average right wrist trajectories of a single participant obtained by MBS (black line), KMS (dotted black line) and IMMUs (grey line) methods.