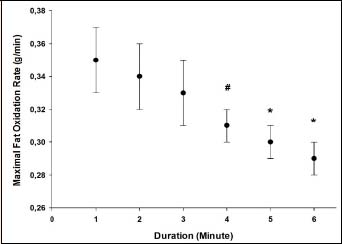
Figure 5.
Changes in the maximal fat oxidation (MFO) rate over time. *: significantly lower than the 1
st
, 2
nd
, 3
rd
, and 4
th
min values (p < 0.01) #: significantly lower than the 2
nd
and 3
rd
min values (p < 0.01).