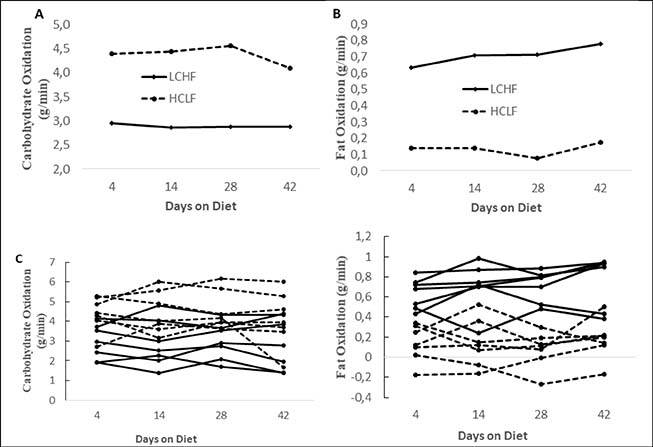
Figure S3. Substrate utilization during the four 5-km time trials. Rate of carbohydrate oxidation (A) and fat oxidation (B). Individual values are shown for rates of carbohydrate oxidation (C) and rates of fat oxidation (D). Data presented as mean ± SD; n = 7. *Significant differences between conditions. Dashed lines represent high carbohydrate low fat treatment and solid lines represent low carbohydrate high fat treatment. LCHF, very low carbohydrate high fat; HCLF, high carbohydrate low fat.