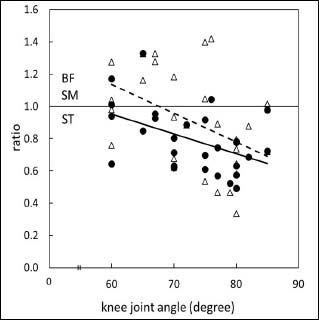
Figure 5. A scatter plot of BFlh/ST and SM/ST corresponding to the knee joint angle. â— and â–³ show BFlh/ST and SM/ST, respectively. The broken line and solid line show the linear regression of a knee angle with BF/ST (y = -0.0208x + 3.5587, r = -0.47) and SM/ST (y = -0.0241x + 3.7886, r = -0.45) (p < 0.05), respectively. The ratio over 1.0 means that the NEMG of BF or SM is higher than that of ST (solid horizontal line).