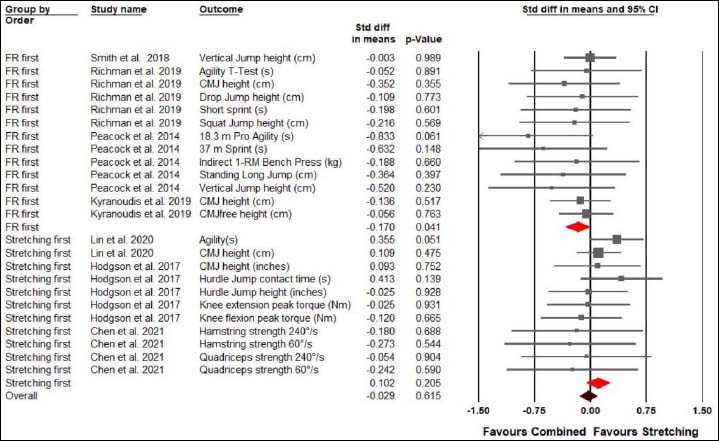
Figure 5. Forest plot presenting the combined effects compared to stretching on performance parameters, including a subgroup analysis with the order of the combined treatment (Std diff in means = standardized difference in means; CI = confidence interval; FR= foam rolling).