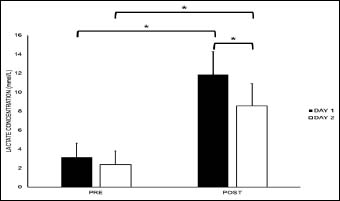
Figure 5. Average blood lactate concentration before and after exercise on the two testing days. Error bars represent the standard deviation of the mean. The asterisks denote statistically significant increases in lactate concentration on both days and greater lactate concentration on Day 1 of data collection.