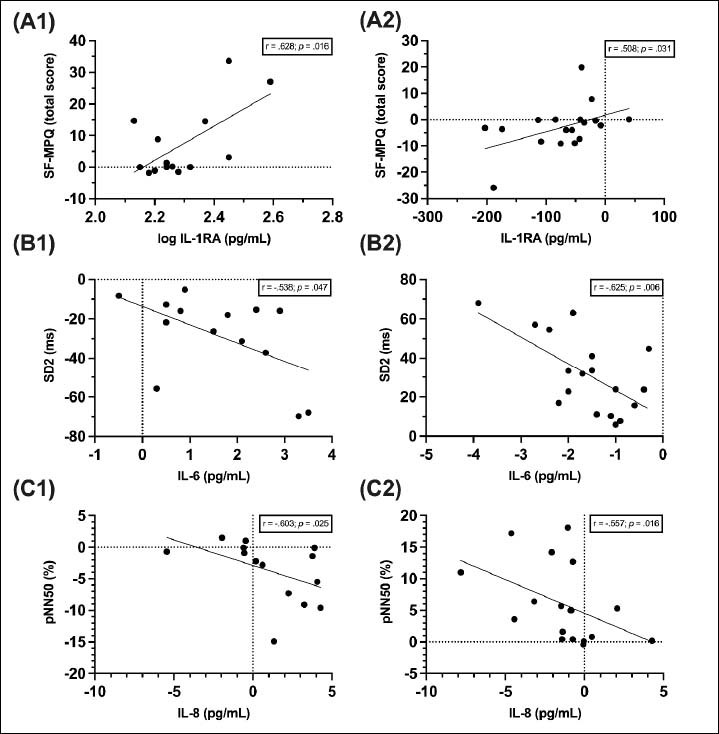
Figure 5. Correlations in moderately trained individuals (n = 14/ 18) (B1/2: IL-1ra and SF-MPQ total score, RT1; C1/2: IL-6 and SD2, RT2; D1/2: IL-8 and pNN50, RT2) at the exercise and recovery response on one RT. Number one of the graphs show the results of the exercise response, number two those of the recovery response. Differences between the MTPs were used for the analyses. Significant correlations are presented with p < 0.05.