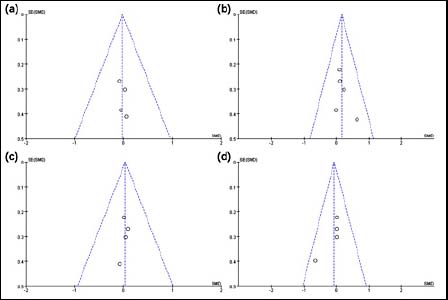
Figure 5.
Funnel plot of publication bias for body mass index (a), body fat (b), waist circumference (c), and lean mass (d) in the CIT vs. PLA.