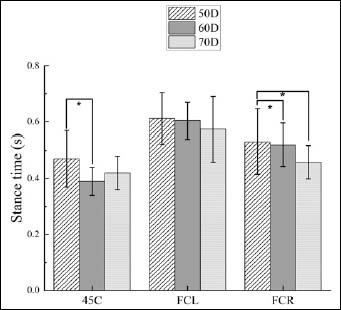
Figure 5.
Bar graph showing stance times at 45C, FCL, and FCR. * = significant difference at p < 0.05.