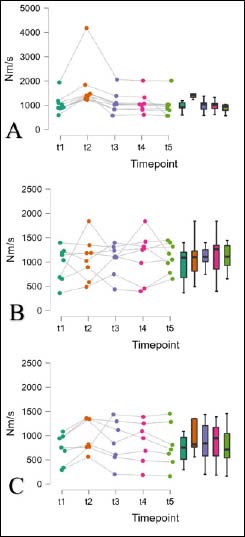
Figure 5. RTD at the tested time points for PAP (A), PAPEE (B) and PAPEV (C). Figure shows individual RTD values as well as a boxplot diagram for the timepoints t1 (baseline), t2 (2 seconds after conditioning contraction (CC)), t3 (4 minutes after CC), t4 (8 minutes after CC) and t5 (12 minutes after CC). Nm/s = Newtonmeter per second.