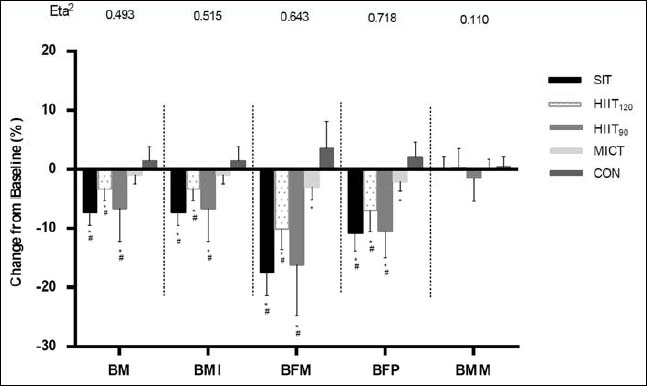
Figure 5. Changes (mean ± SD) in Body mass (BM), Body mass index (BMI), Body fat mass (BFM), Body fat percentage (BFP), and Body muscle mass (BMM) from baseline (0%) to post-training measures among SIT, HIIT120, HIIT90, MICT, and CON. *Significantly (p < 0.05) different from CON; #Significantly (p < 0.05) different from MICT. Effect size (Eta2) for the difference among the five groups is shown on the top of the graph.