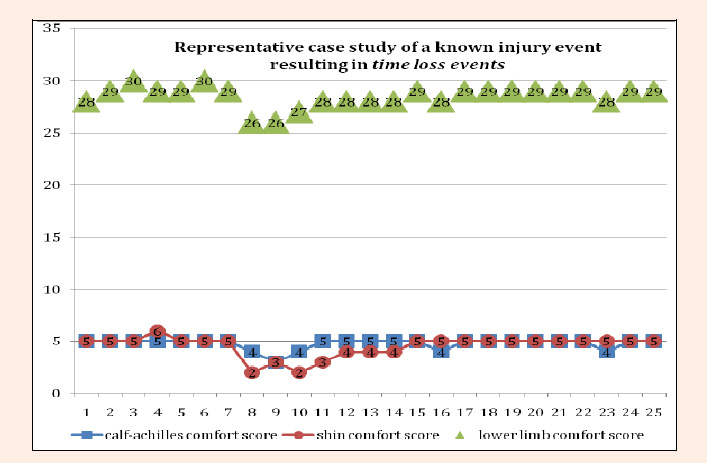
Figure 6.
Representative case study of a known time loss event. The x-axis represents player comfort weeks, 1-25; the y-axis comfort scores 0-35.