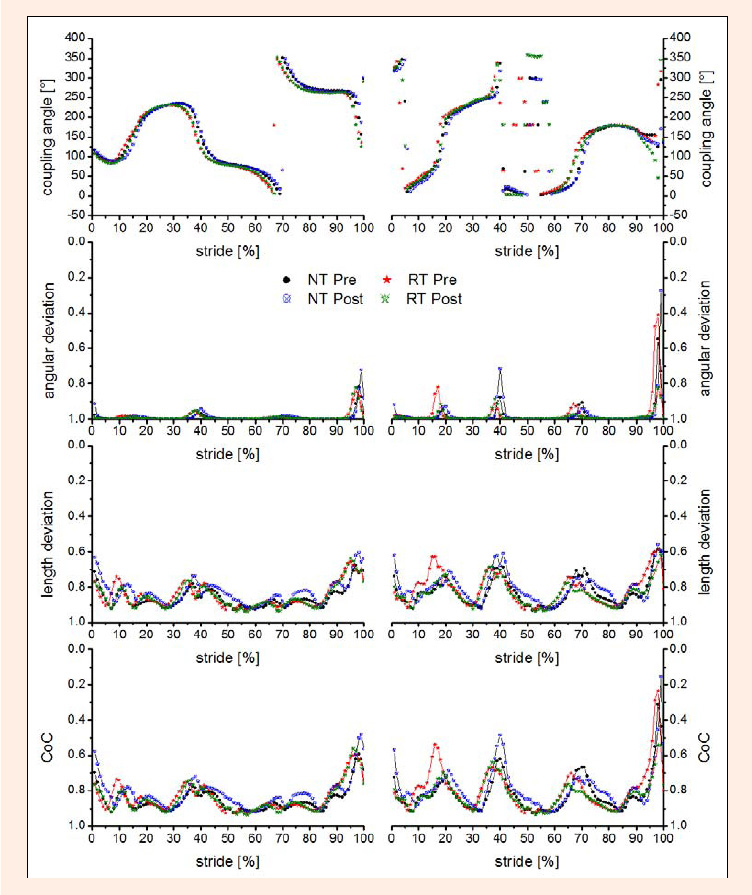
Figure 6. Mean vector coding plots of one representative runner. The left column represents the hip-knee data, the right column the knee-ankle data. Mean coupling angle (a), mean angular deviation (b), mean length deviation (c), and mean coefficient of correspondence (d) for the respective couplings. The coupling angle in particular demonstrates the differences observed in joint angle values; however, within each situation, the variability is rather low, as supported by the VC results.
