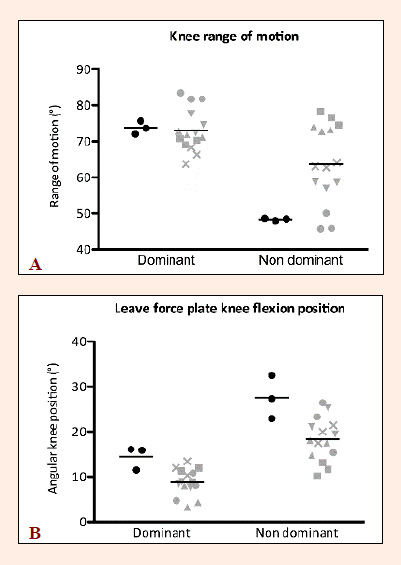
Figure 6. Extension knee range of motion (A) and knee angular flexion when leaving force plate (B) for player and group. Each plot represents one of the 3 best serves of a player. Each symbol represents a different player. We express means of player and group as degree (°).Values for the player (n = 1; black) and the group (n = 5; grey).