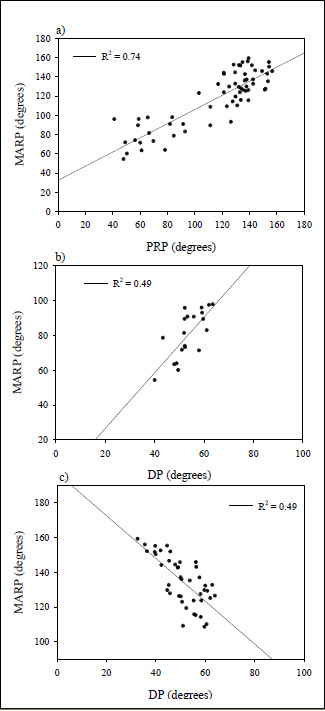
Figure 6. Graphs represents linear relationship between a shoulder-hip (SH) mean absolute relative phase (MARP) and point-estimation relative phase (PRP) values (a), and relationship between SH MARP and DP values when SH MARP values were categorized as < 100° (b) and > 100° (c). R2 represents the amount of variance explained by the associations.