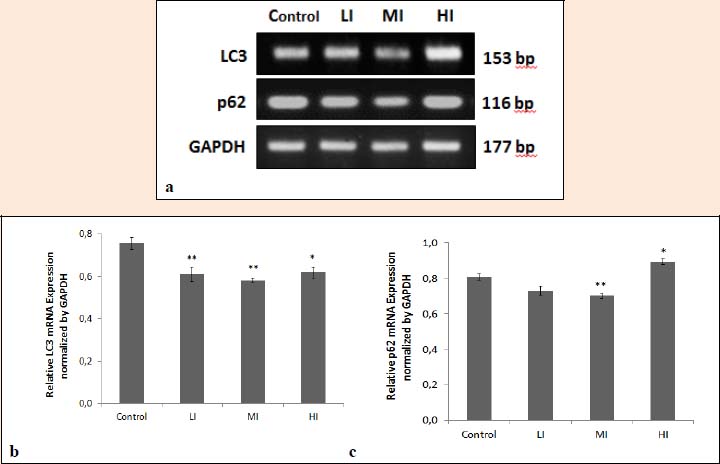
Figure 4. Alteration of autophagy gene expression in soleus muscles of wistar rats by different intensities of exercise. a. LC3 and p62 expressions in control and different intensities of exercise : low-intensity (LI), moderate-intensity (MI), and high-intensity (HI). b. Relative LC3 mRNA expression normalized by GAPDH in soleus muscles of wistar rats. c. Relative p62 mRNA expression normalized by GAPDH in soleus muscles of wistar rats. Bar graphs represent mean ± SEM. *, p < 0.05 versus the corresponding control group. **, p < 0.01 versus the corresponding control group