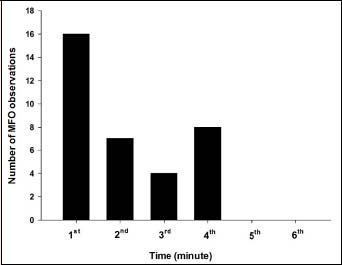
Figure 6.
Frequency distribution of the number of participants who reached their individual maximal fat oxidation (MFO) rate with respect to the time in the Fatmax stage.