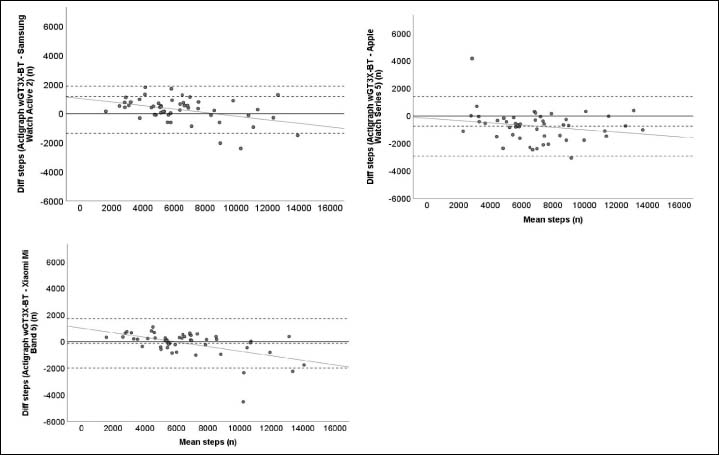
Figure 6. Bland-Altman plots of the three devices for measuring steps under unstructured free-living conditions. The middle line shows the mean difference between the measurements of steps of the three activity trackers and the ActiGraph and the dashed lines indicate the limits of agreement.